Digital Shelf Analytics
helps you spot and take advantage
of macro & micro trends in your category
Measure your performance within the market, benchmark yourself against competitors, dive into analysis on stores, new and high-selling items, and more!
English Disclaimer:
The data and information provided on this website may be derived from various public sources and may be subject to discrepancies due to timeliness and the inherent characteristics of the e-commerce industry. We make no warranties regarding the accuracy, completeness, or timeliness of the information. Such information is for internal reference only and should not be considered as conclusive opinions issued by this website.
Additional Disclaimer for Comparison Data:
The comparison information we present is derived from the integration of publicly available data that we have collected and is for reference only. Please note that this information does not represent accurate market share or other relevant metrics, nor should it be construed as our opinion or position. We recommend that users conduct their own verification and judgment when using this information, and we do not assume any responsibility for any losses or adverse consequences that may arise from the use of this information.
Category Monitoring
How is your ecommerce category performing and who is driving sales?
Track online market trends, platform splits, winners and losers at the item, store, or brand level.


Price & Promotion Monitoring
What are your competitors' latest pricing and promotional strategies?
Analyze hourly pricing and promotion for your brand's items or those of the competition.
Sentiment Analysis
What are people saying about your product, brand and segment?
Better understand consumer perception of your brand & products, and identify any unmet market needs.


Consulting
Your trusted advisor for the most complex digital challenges facing business today.
Insights for our clients' most critical issues and opportunities: strategy, marketing, and operations across all industries and geographies.
Features
Macro insights cover all the platforms driving revenue for your categories and subcategories, brands, stores, and SKUs.
See monthly trends of your market along with channel breakdowns for leading Chinese platforms!
Full visibility into your brands or stores’ online performance across platforms and categories: benchmark yourself against the market and key competitors.
Identify this month’s new and fastest-growing items.
We track all your key competitors’ and distributors’ pricing daily. You can follow the changes in prices over time to see how you compare and gain insight into current pricing strategies.
Use AI to tag and sort items by multiple attributes. Perfect for marketing and R&D teams to analyze segment trends by product ingredients, functional claims, pricing bands and more!
Competitve Advantages

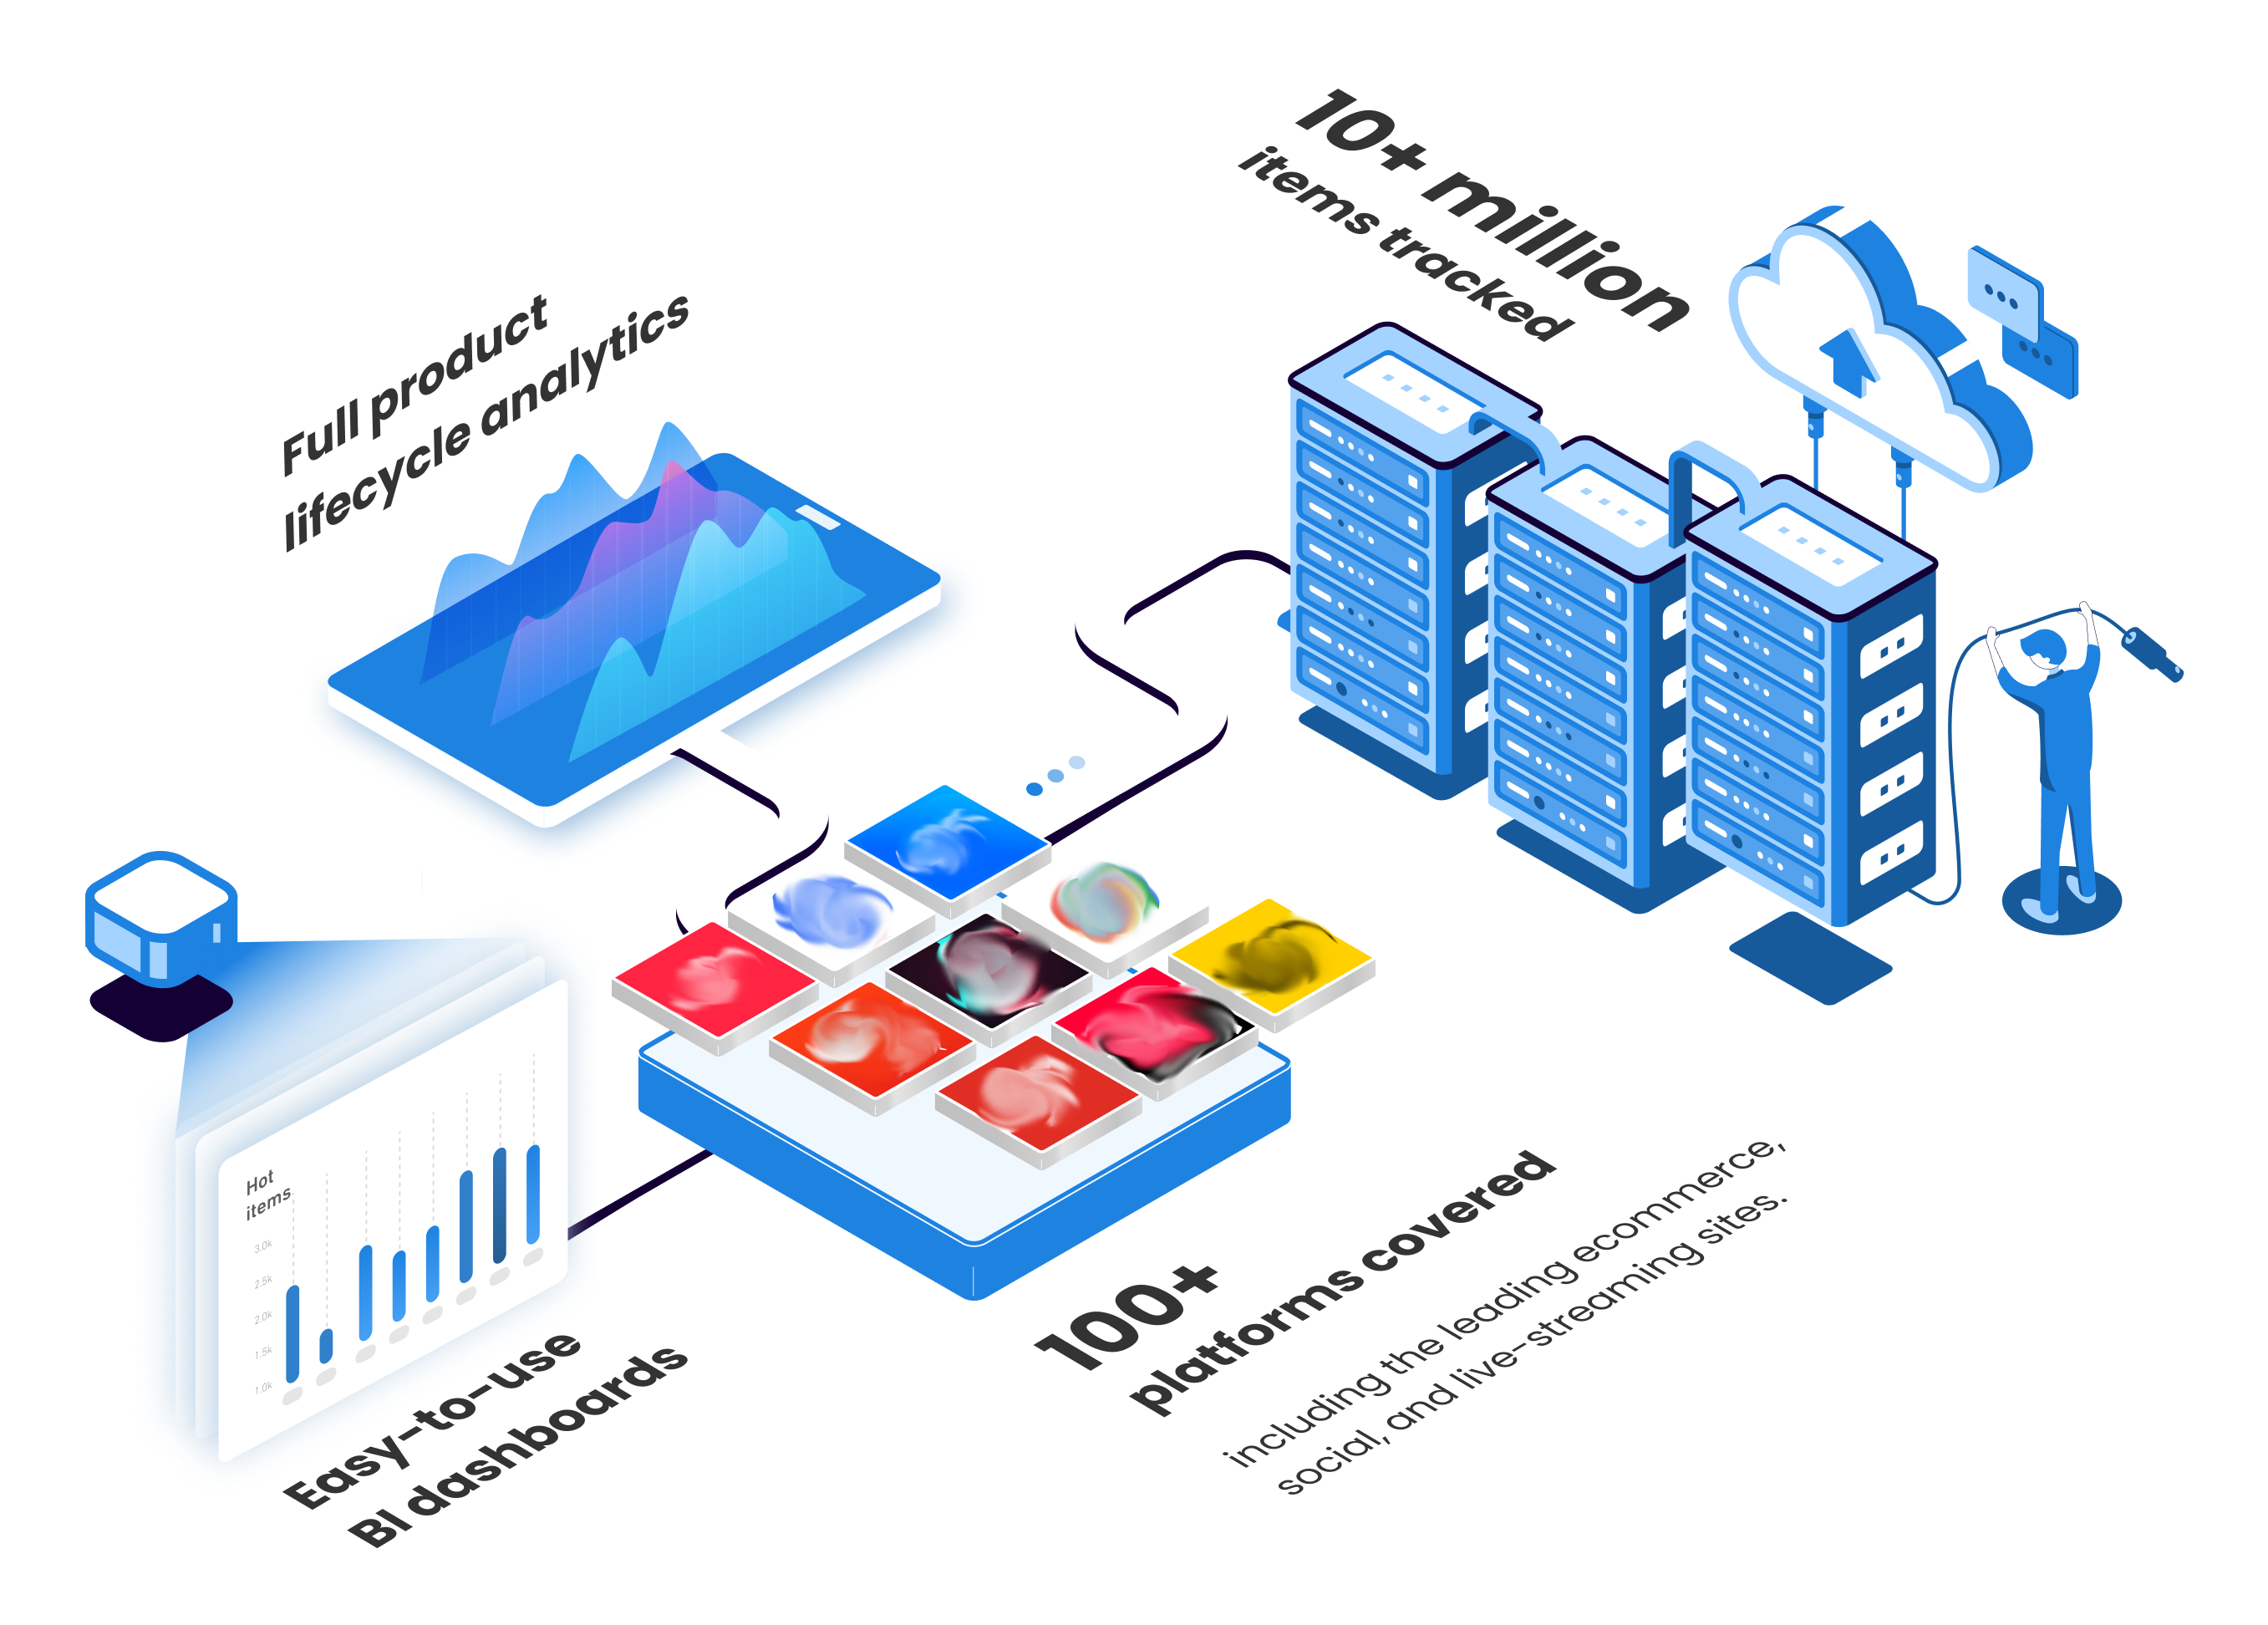
100+ platforms covered
Ongoing data collection from 100+ platforms across the world, including the leading ecommerce, social, and live-streaming sites
Full product lifecycle analytics
From NPD, market entrance, pricing strategy, competitor benchmarking to consumer feedbacks, we analyze data fields that are critical to each business department
Easy-to-use BI dashboards
Intelligent, interactive, and cloud-based analytics platforms
Data Plans
Free and Professional Data plans will be available for the base Health & Nutrition categories which include any health supplements with the exception of Traditional Tonics (Traditional Chinese Medicine) and Medicine/OTC products. Enterprise subscriptions can cover any of the above and can be further customized.
Industries Covered

Featured Case Studies
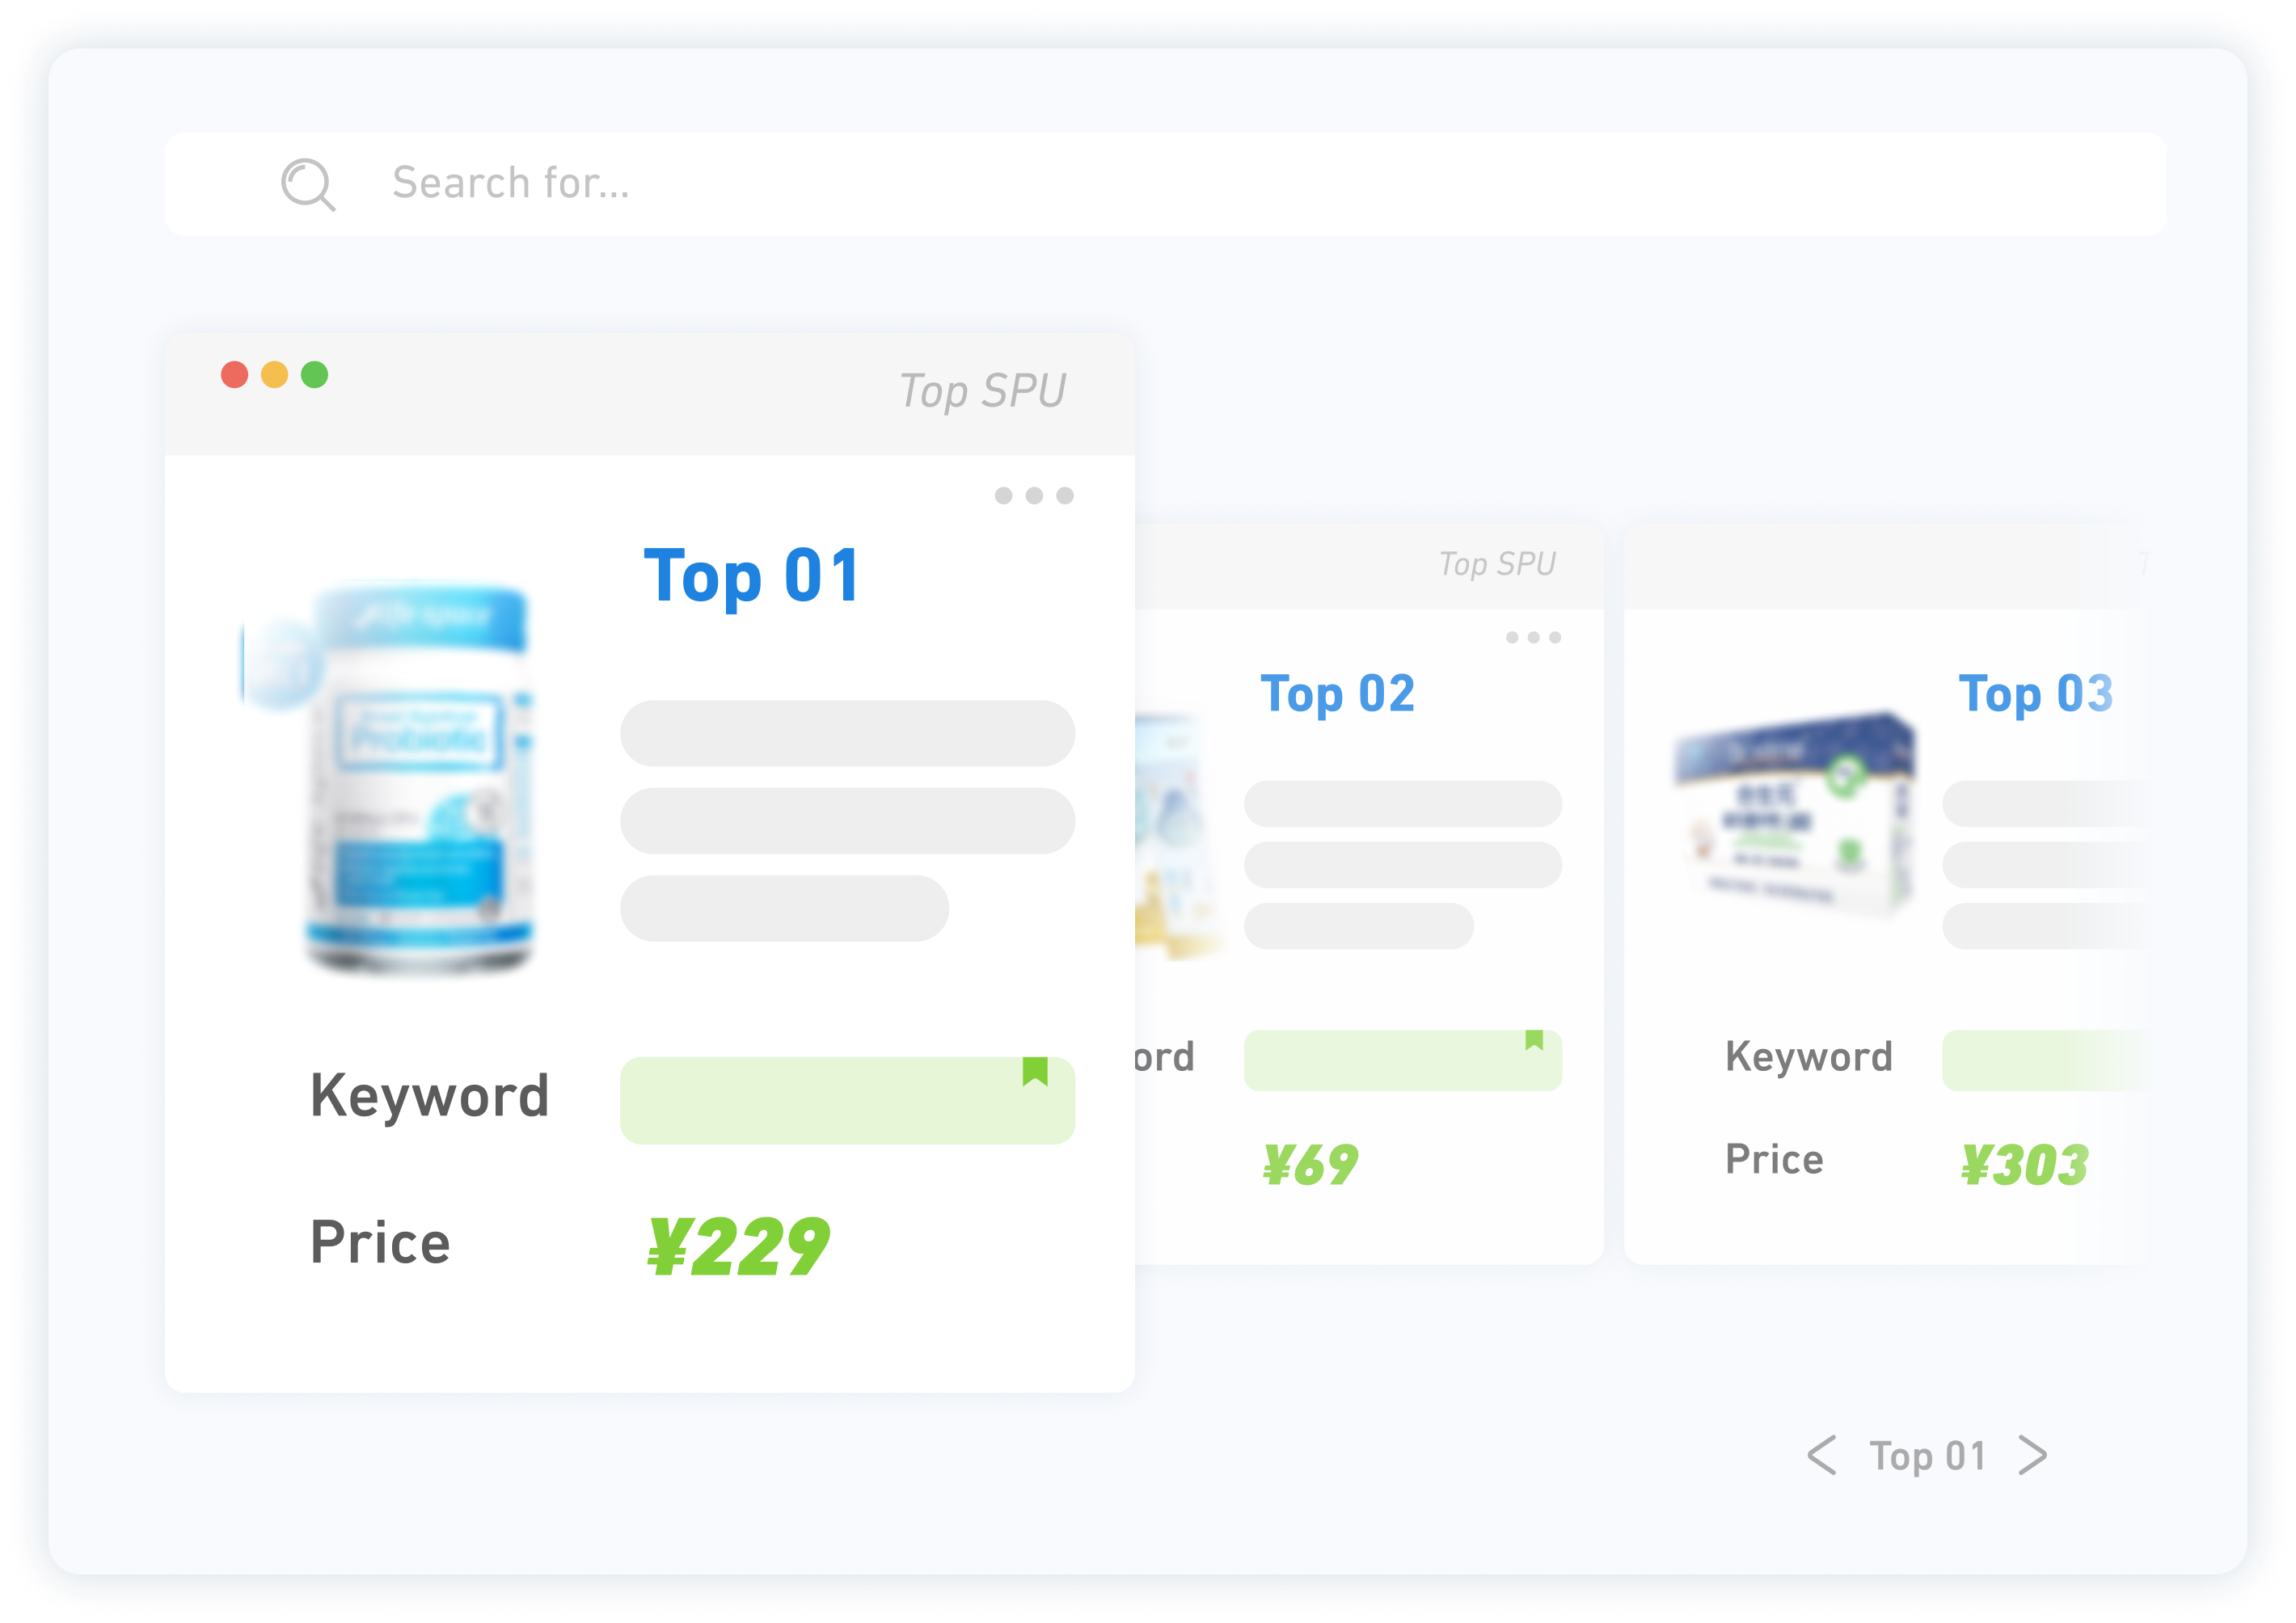
01 SPU Reporting (VMS)

Request
The BD team of a global food ingredient provider wants to know the best-selling probiotic supplement items online. The most difficult task is to combine SKU links across stores/platforms.
Early Data Solutions
Based on the standard product names confirmed with the client, Early Data leverages exclusive product clustering algorithms and self-development human-in-the-loop auditing system Arcade to do SKU mastering, classifying different SKUs into master items (SPU).
Process

Achievement
The client is now able to check monthly best-selling probiotic supplement items across different stores/platforms.
02 Price Monitoring (OTC)

Request
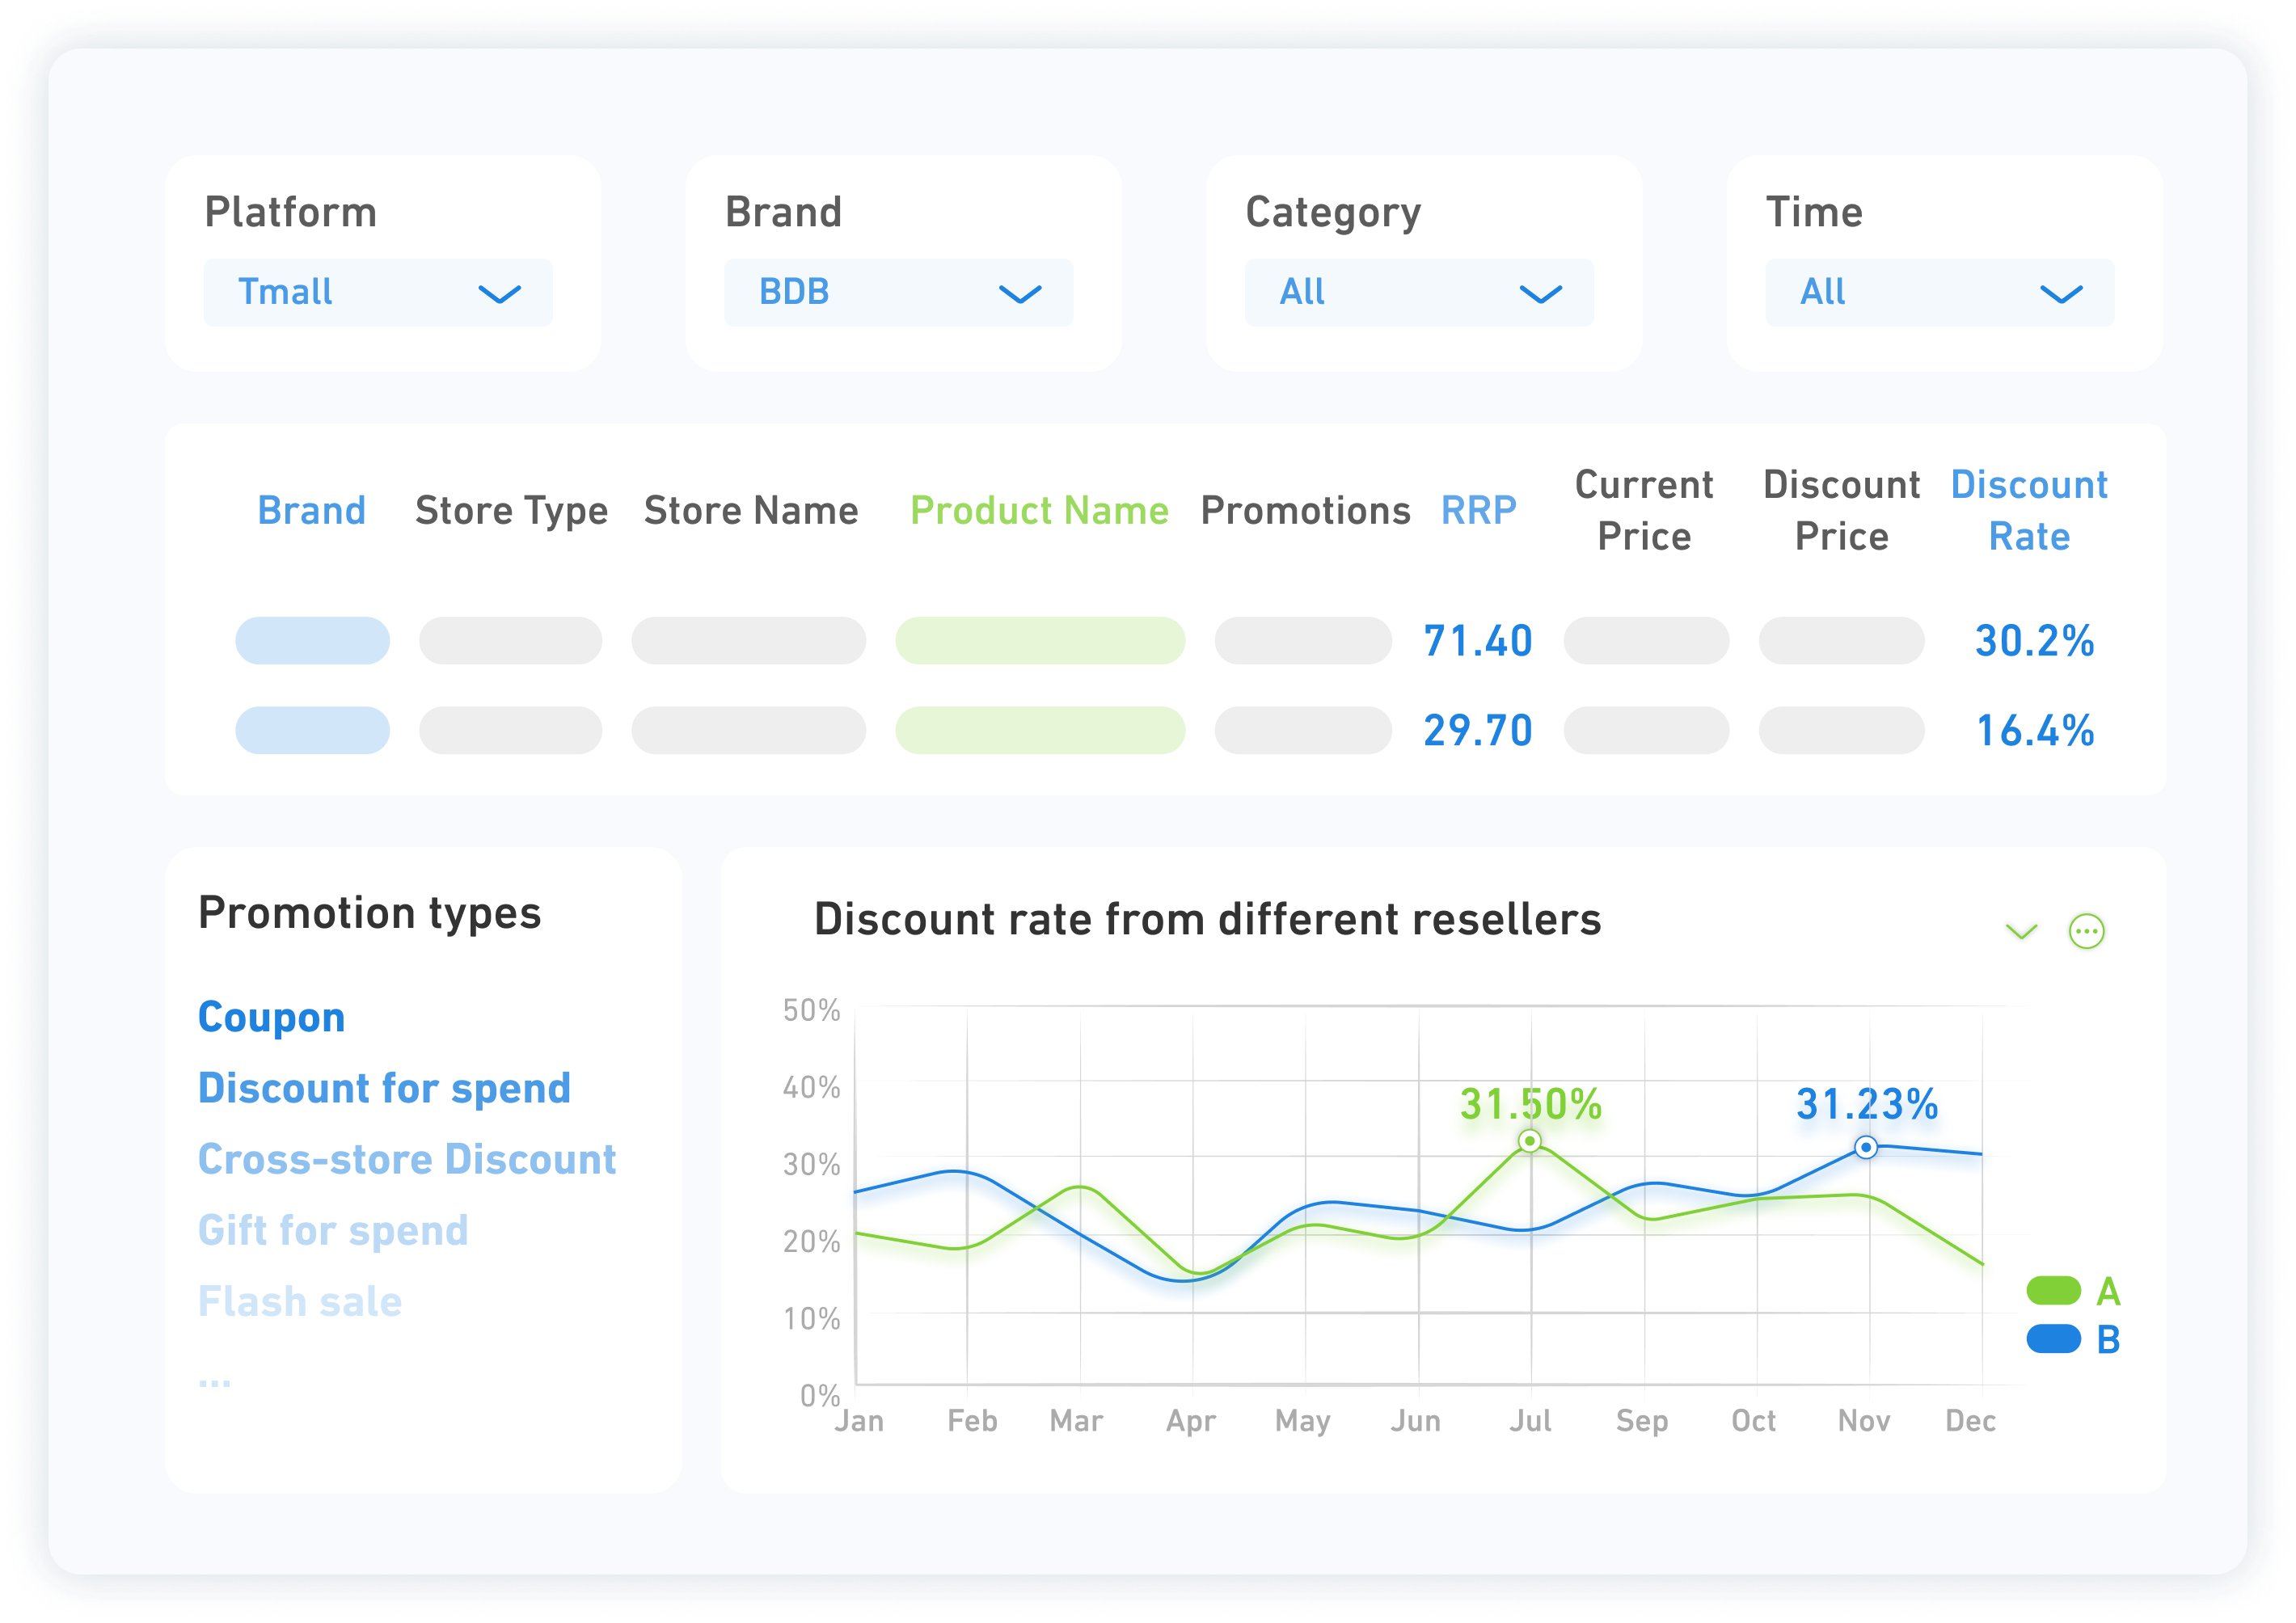
The compliance team of a domestic pharmaceutical company want to know if their resellers/distributors are following their pricing/promotion strategies.
Early Data Solutions
Based on the recommended retail price (RRP) provided by the client, Early Data tracks product price changes at certain time intervals and compare those with the RRPs.
Process

Achievement
The client is now able to identify price violations with timely notifications/alerts and spot the right item and resellers/distributors.

Get 14-day Free Access to
- Monthly Top 10 Brands
- Monthly Top 10 Products
- Monthly Category Ranking
